
A data comparison by Truthfal of the Covid-19 death rates between spring 2020 and now suggests there are reasons for optimism that the South-West could soon be out of this lockdown.
But don’t lower your guard just yet – while the trends are similar, we have sadly seen a far higher number of deaths during the winter lockdown.
With the Government due to announce its so-called ‘road map’ out of lockdown on Monday, talk has inevitably turned to when the restrictions will ease this time around, to allow businesses to prepare for reopening and families to think about when they can see their loved ones again.
Our analysis suggests that the South West is in step with the rest of the country in seeing an encouraging downward curve to the number of cases and deaths. It remains crucial to remain patient, however.
The graph below (exhibit A) shows the last ten weeks of death rates in the South West of England, from December 4, 2020 until February 5, 2021, which is when the latest data from the Office for National Statistics was released.
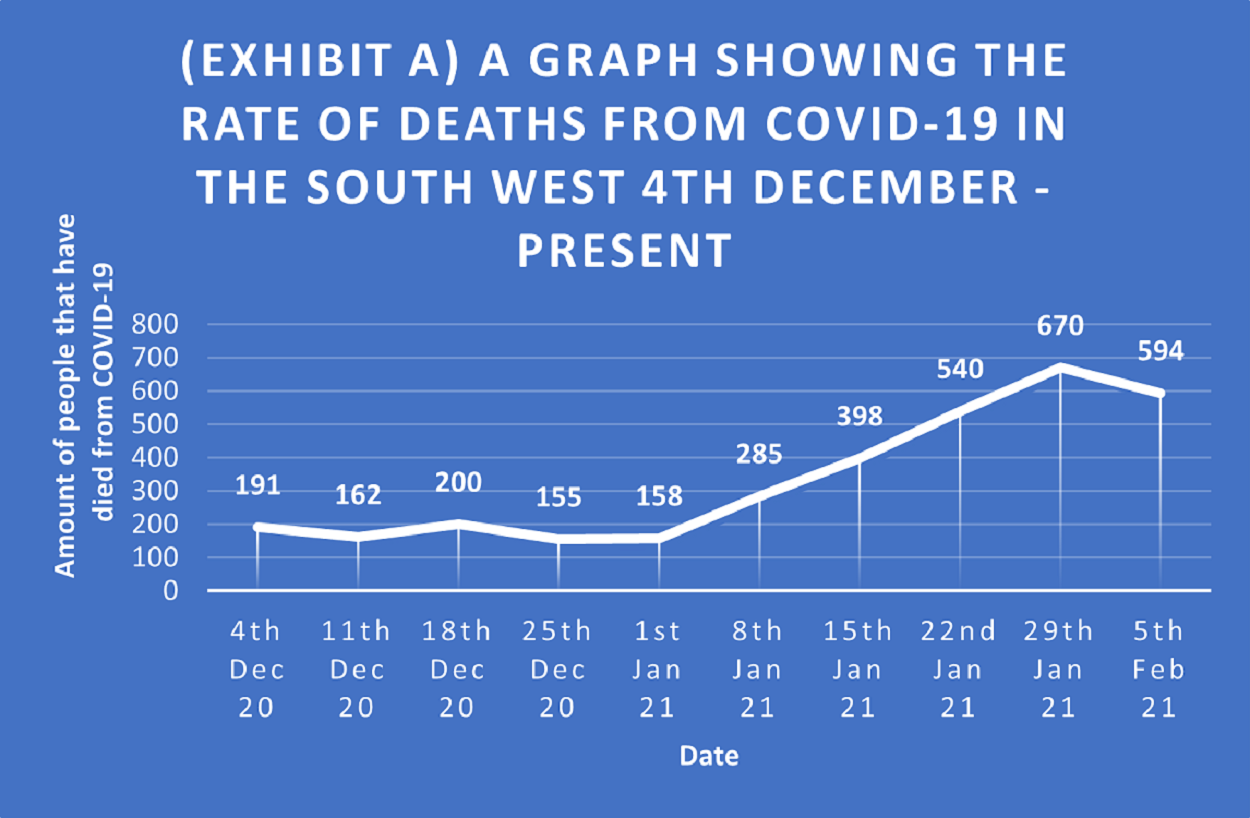
Steep rise: A graph the depicts the steep rise in deaths in the South West from COVID-19 from 4/12/20 to 5/2/21
The graph shows that there has been a steep rise in cases throughout December and January with only the last two weeks showing the rate start to decrease.
Compare that to the ten weeks prior to the easing of the first lockdown lockdown on May 10 last year, shown below.

Similar: A graph the depicts the death rates from COVID-19 in the South West from 6/3/20 to 8/5/20
Exhibit B shows a very similar trend to exhibit A with a steep rise in cases before a decrease in the rate become apparent.
If we put both graphs alongside each other like this shown below (exhibit C), you will see the very similar trend for both ten-week blocks. The major difference is the lower number of deaths during the first lockdown.
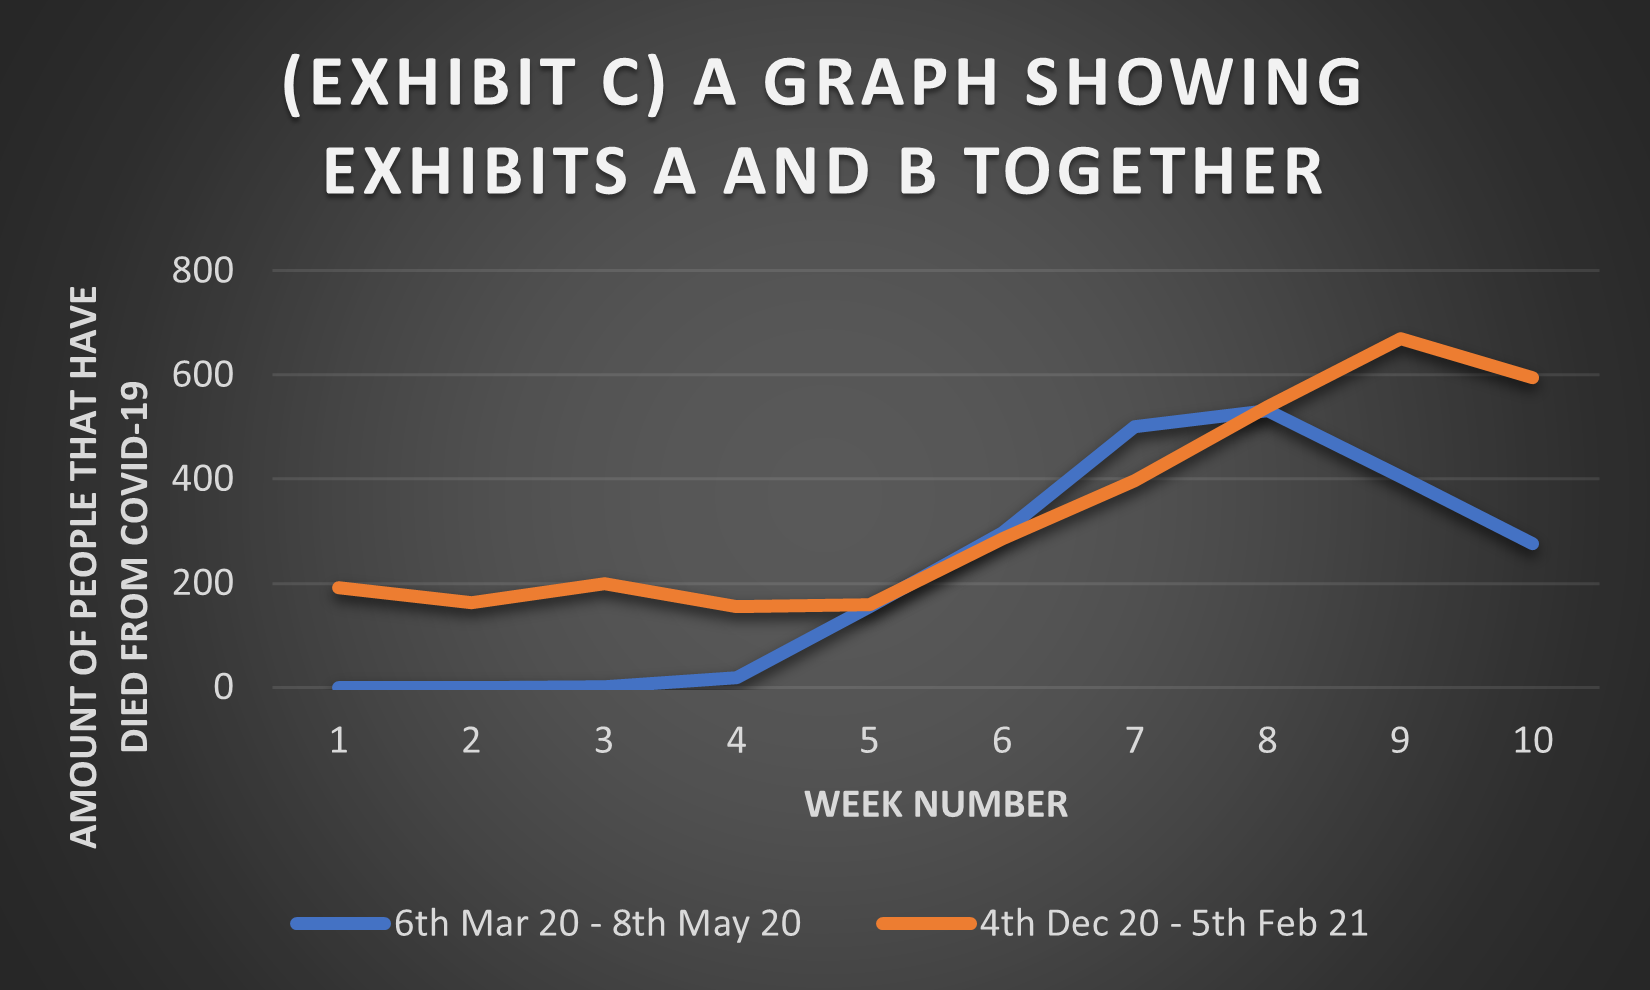
Comparison: A graph that shows the comparison between ten weeks in Lockdown 1 and ten weeks in Lockdown 3
Back in March last year, the future seemed bleak but with relative compliance to the lockdown restrictions, the country began to change to the ‘new normal’ with social distancing, face coverings and curfews in place.
The major difference this time around is the introduction of the vaccine and its apparent impact on the death rate.
We will find out on Monday whether Prime Minister, Boris Johnson, will opt to keep the country in lockdown and allow the vaccine to be distributed further or whether he will begin to lift some of the tighter restrictions that are in place.
Related stories:
- University students campaign for Covid-19 relief funding
- Lockdown 3.0: Let’s set more realistic expectations for ourselves
- Learner drivers in limbo as restrictions delay tests